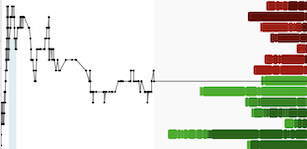


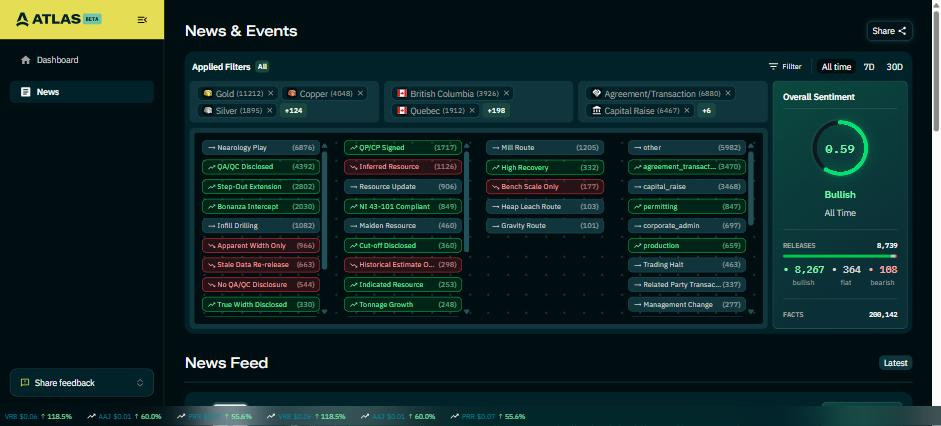
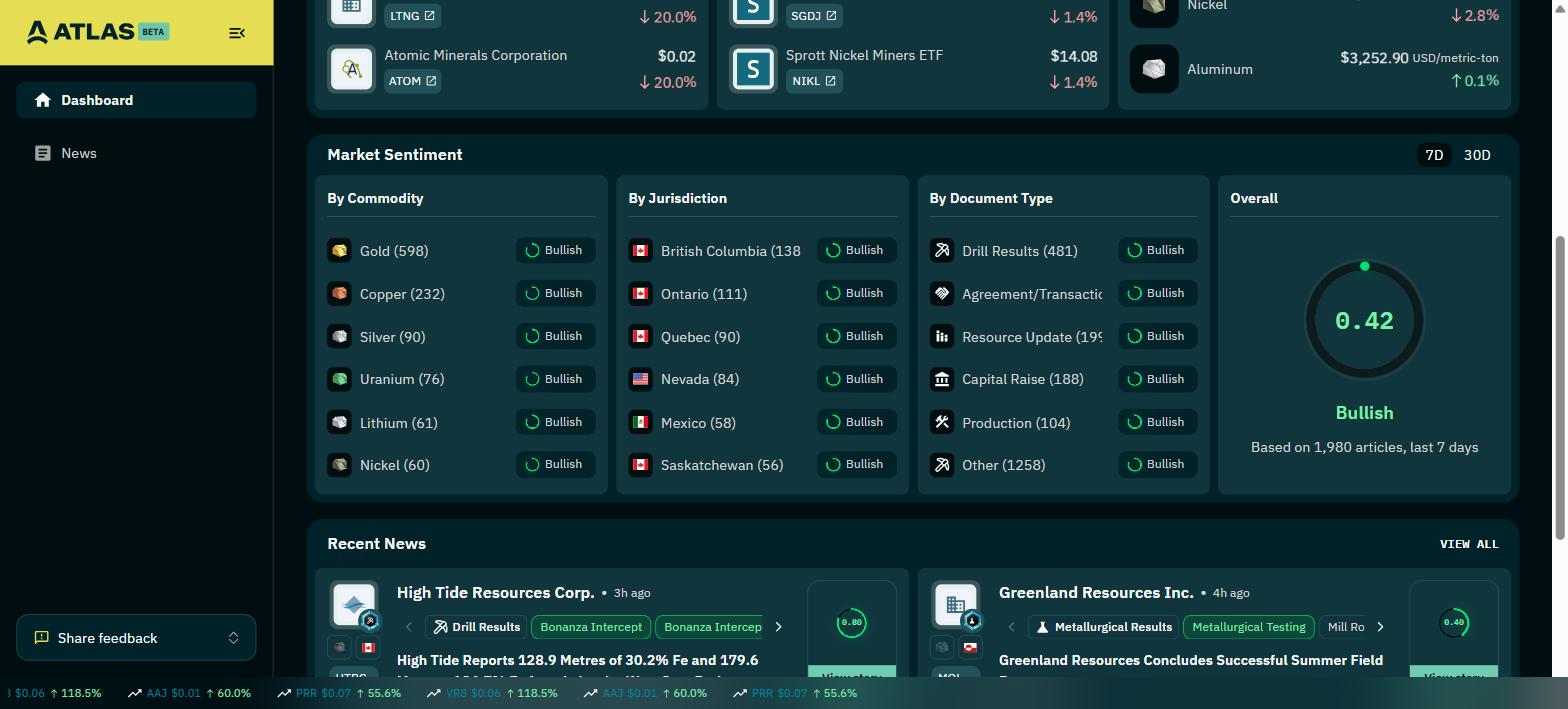
Roughly 1,980 mining releases hit the wire in the last seven days. That is the count sitting on the Atlas dashboard right now, across gold, copper, silver, uranium, lithium and nickel, spread over British Columbia, Ontario, Quebec, Nevada, Mexico and Saskatchewan. Nobody reads 1,980 releases. Nobody reads 200.
So the filtering happens anyway. It just happens badly, through whatever an aggregator floats to the top, which measures publicity rather than substance. The geologist ends up assessing three companies closely and ignoring forty. The analyst covers the names already in the model and misses the one where something quietly changed.
A mining intelligence platform is not a news reader. Its job is to do the first pass you do not have time for, and to show its working so you can disagree with it. Atlas is in beta, and everything below is running today.
The problem is disclosure variance, not information scarcity
NI 43-101 and JORC set out what must be disclosed. Neither says how to present it. So one company leads with grade, another with contained metal, another with a metal-equivalent figure that never names its price assumptions. All three can be fully compliant while telling you very different amounts.
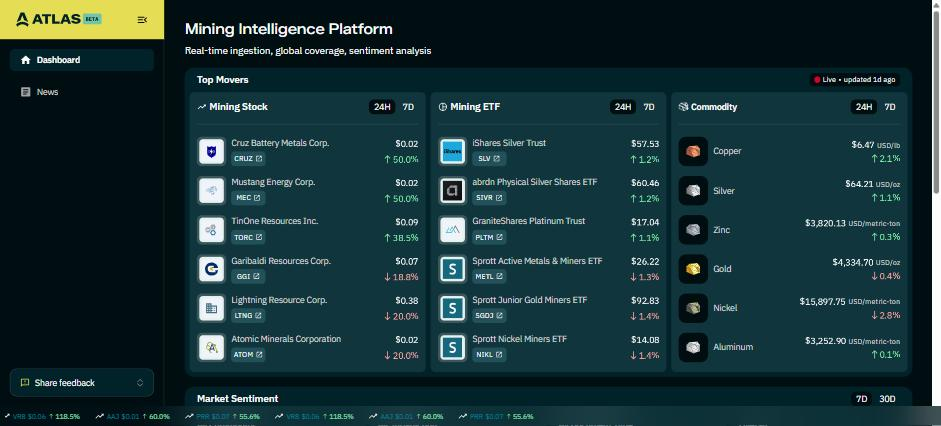
That variance is measurable. Across the Atlas corpus of 8,739 analysed releases and 200,142 extracted facts, the tag counts look like this:
Apparent Width Only: 966. True Width Disclosed: 330. Nearology Play: 6,876. QA/QC Disclosed: 4,392. No QA/QC Disclosure: 544. Stale Data Re-release: 663. Cut-off Disclosed: 360. Cut-off Undisclosed: 131. Bench Scale Only: 177. Metal Equivalent Opaque: 118.
Read the first two slowly. Apparent Width Only outnumbers True Width Disclosed by roughly three to one. For a geologist that is the difference between a thickness and a hole length, and it is not a rounding error. It is the single most common gap in drill reporting, and it is invisible if you read releases one at a time, because each individual release looks normal.
Four releases from a single day
Everything below came off the platform on 17 September 2026. All of it is public data, and each example links to the original announcement.
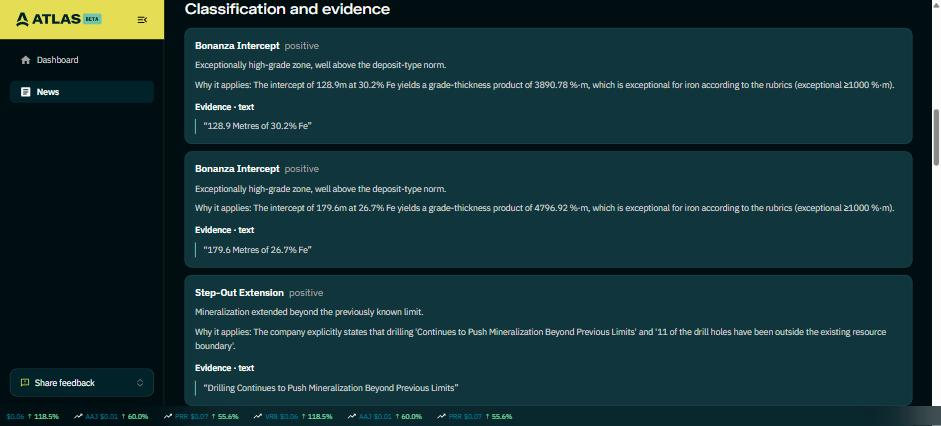
A strong result, correctly flagged. High Tide Resources (HTRC) reported 128.9 m of 30.2% Fe and 179.6 m of 26.7% Fe at Labrador West. Atlas tagged both intercepts Bonanza Intercept, and it says why: a grade-thickness product of 3,890.78 %-m against a threshold of 1,000 %-m for iron. It also tagged Step-Out Extension, QA/QC Disclosed and Compositing Transparent, because 11 of 13 holes sat outside the existing resource boundary and the lab work is documented. Then it tagged Apparent Width Only, noting true widths are estimated at 80-90% of core length. That does not undo the result. It tells a geologist what to check first.
Source: https://webfiles-primary.thecse.com/news_releases/en/3957/03e64614-c4fd-42f7-b451-2281859387d6
The same gap, in a different pair of hands. Newcore Gold (NCAU) reported 69 m at 2.59 g/t Au and 24 m at 6.41 g/t at Enchi in Ghana. Same Apparent Width Only flag, with the company's own sentence quoted back: "Reported intercepts are hole lengths, with true widths estimated at 75% to 85%." Both companies disclosed properly. The point is that the platform catches it consistently, on a Wednesday, across every release, without anyone remembering to look.
Source: https://www.northernminer.com/news/newcores-wide-gold-hit-boosts-enchi-plan-in-ghana/1003894935/
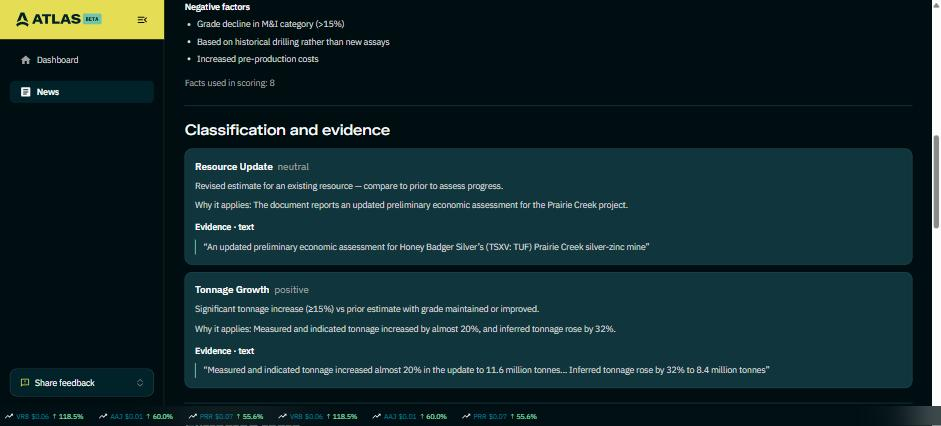
The one analysts should care about most. Honey Badger Silver (TUF) nearly tripled the Prairie Creek PEA value to $1.2 billion. Atlas tagged Tonnage Growth as positive and quoted the numbers: measured and indicated up almost 20% to 11.6 Mt, inferred up 32% to 8.4 Mt. Underneath, in the same analysis, sit three negative factors: a grade decline in the M&I category greater than 15%, an estimate based on historical drilling rather than new assays, and increased pre-production costs. The resource fact record carries its own flag: historical result, needs review. More tonnes at a lower grade, from old drilling, with higher upfront costs, presented as a tripled NPV. Every one of those facts is in the source document. The headline is not wrong. It is just not the whole disclosure, and reconstructing that by hand takes an analyst half an hour per release.
One for the metallurgists. Greenland Resources (MOLY.TO) collected 8 tonnes of core and 14 tonnes of water for pilot plant testing at Malmbjerg. Atlas recorded the mill route as neutral and flagged Single Domain Only, because one composite was tested. Representativeness is not established yet. That is exactly the question a process engineer asks and a headline never answers. Source: https://orestocks.com/company/MOLY.TO/press-releases/7021982584690893
Where the aggregate view earns its keep
A single tag is a detail. The pattern is the signal. Because every release carries structured tags, you can ask questions no feed answers: which Saskatchewan uranium explorers disclosed QA/QC this quarter, how many BC copper resource updates stated a cut-off grade, whether a management team omits true width once or every single time. Disclosure discipline follows people across companies, and it only becomes visible when you can line up comparable releases.
The Nearology Play count is worth sitting with too. It is the largest tag in the taxonomy at 6,876 releases, which says a lot about how much of the sector's news flow is about someone else's ground.
Atlas is in beta, and it helps to be plain about that
Atlas is live and analysing releases daily, but it is early. The tag taxonomy is still growing. Some tags are canonical, with published definitions and thresholds behind them. Others are story-specific and marked as such in the analysis. Coverage keeps widening as more exchanges and newswires come into the ingestion.
The model also gets things wrong. It misreads tables sometimes. It occasionally elevates a background mention into a headline finding, and it does worse on older or badly formatted documents. Every tag carries the exact sentence that triggered it precisely so you can catch it out, and people already have. Being in beta is why feedback lands differently right now: the taxonomy is not frozen, so a geologist saying you are missing the check I actually run can change what gets built rather than joining a queue.
What it does not do
It does not make the call. Atlas publishes no price targets and no recommendations, and the companies above are illustrations of the tooling, not views on the stocks. The source announcement is still the thing you assess. What the platform buys you is knowing which twelve of this week's releases deserve that hour.
Try it, and tell us what is missing
Atlas is open to explore in beta: https://minestarters.com/atlas . Pick a commodity and a jurisdiction you know well, and see whether the tags match your own read of releases you have already formed a view on. That is the fairest test, and if they do not match we would rather hear it.
If something is wrong, or a tag you rely on does not exist yet, there is a Share feedback button on every screen. Feature requests genuinely shape what gets built next, particularly from geologists and analysts who read this material for a living. The team has several additions in progress that will roll out shortly.
Disclosure: I work on Atlas at Minestarters. Atlas is an information and research tool, currently in beta. It does not provide investment advice, recommendations, price targets, or an offer to buy or sell securities. Companies named above are illustrative of the tool's output. Readers should review source documents and make their own assessment. Figures captured 17 September 2026.
AI disclosure: This article was drafted with AI assistance (Claude Opus 5 by Anthropic, via Claude Code) from Atlas platform data, and reviewed by me before posting.